
Clever Tips For When You Are Selling | Rick the REALTOR®


Be the first to know! Read our monthly housing market reports to get the most up-to-date statistics and to hear our perspective on what the latest buying and selling trends mean for you.
Strong December activity brought Metro Vancouver’s* 2020 home sales total in line with the region’s long-term annual average.
The Real Estate Board of Greater Vancouver (REBGV) reports that residential home sales in the region totalled 30,944 in 2020, a 22.1 per cent increase from the 25,351 sales recorded in 2019, and a 25.7 per cent increase from the 24,619 homes sold in 2018.
Last year’s sales total was 2.8 per cent below the 10-year sales average.
Home listings on the Multiple Listing Service® (MLS®) in Metro Vancouver reached 54,305 in 2020. This is a 4.6 per cent increase compared to the 51,918 homes listed in 2019 and a 1.3 per cent increase compared to the 53,614 homes listed in 2018.
Last year’s listings total was 2.7 per cent below the region’s 10-year average.
“After adapting to the COVID-19 environment, local home buyer demand and seller supply returned at a steady pace throughout the summer, fall and winter seasons," Gerber said. "Shifting housing needs and low interest rates were key drivers of this activity in 2020. Looking ahead, the supply of homes for sale will be a critical factor in determining home price trends in 2021.”
The MLS® HPI composite benchmark price for all residential properties in Metro Vancouver ends the year at $1,047,400. This is a 5.4 per cent increase compared to December 2019.
The benchmark price for apartments increased 2.6 per cent in the region last year. Townhomes increased 4.9 per cent and detached homes increased 10.2 per cent.
REBGV reports that residential home sales in the region totalled 3,093 in December 2020, a 53.4 per cent increase from the 2,016 sales recorded in December 2019, and a 0.9 per cent increase from the 3,064 homes sold in November 2020.
Last month’s sales were 57.7 per cent above the 10-year December sales average and is the highest total for the month on record.
There were 2,409 detached, attached and apartment properties newly listed for sale on the MLS® in Metro Vancouver in December 2020. This represents a 51.7 per cent increase compared to the 1,588 homes listed in December 2019 and a 40.8 per cent decrease compared to November 2020 when 4,068 homes were listed.
The total number of homes currently listed for sale on the MLS® system in Metro Vancouver is 8,538, a 0.8 per cent decrease compared to December 2019 (8,603) and a 23.2 per cent decrease compared to November 2020 (11,118).
For all property types, the sales-to-active listings ratio for December 2020 is 36.2 per cent. By property type, the ratio is 35.2 per cent for detached homes, 50.4 per cent for townhomes, and 33.1 per cent for apartments.
Generally, analysts say downward pressure on home prices occurs when the ratio dips below 12 per cent for a sustained period, while home prices often experience upward pressure when it surpasses 20 per cent over several months.
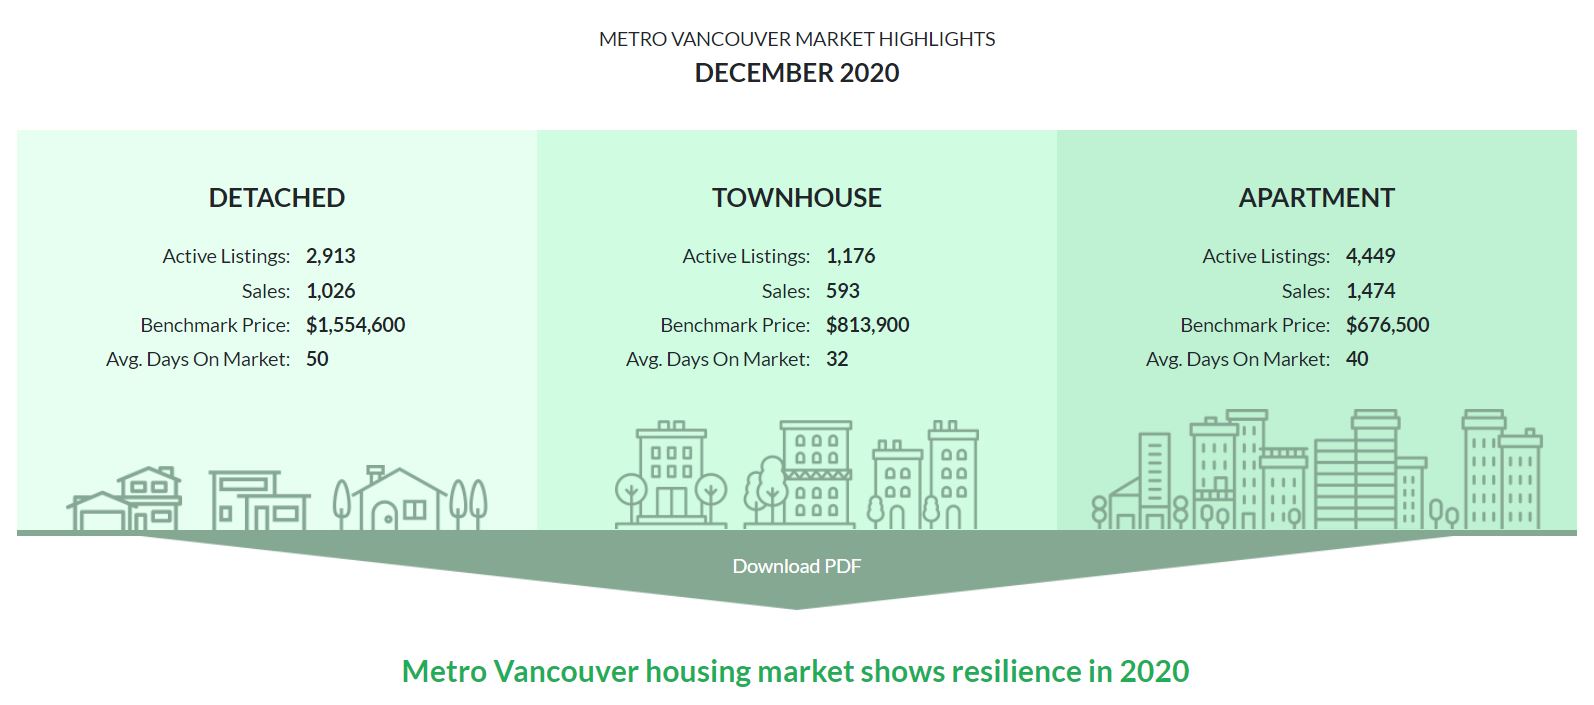
Sales of detached homes in December 2020 reached 1,026, a 71.3 per cent increase from the 599 detached sales recorded in December 2019. The benchmark price for detached homes is $1,554,600. This represents a 10.2 per cent increase from December 2019 and a one per cent increase compared to November 2020.
Sales of apartment homes reached 1,474 in December 2020, a 40 per cent increase compared to the 1,053 sales in December 2019. The benchmark price of an apartment property is $676,500. This represents a 2.6 per cent increase from December 2019 and is unchanged from November 2020.
Attached home sales in December 2020 totalled 593, a 62.9 per cent increase compared to the 364 sales in December 2019. The benchmark price of an attached home is $813,900. This represents a 4.9 per cent increase from December 2019 and a 0.1 per cent decrease compared to November 2020.
* Areas covered by the Real Estate Board of Greater Vancouver include: Burnaby, Coquitlam, Maple Ridge, New Westminster, North Vancouver, Pitt Meadows, Port Coquitlam, Port Moody, Richmond, South Delta, Squamish, Sunshine Coast, Vancouver, West Vancouver, and Whistler.